Make Honesty Less Risky Than Silence for Your Engineering Team

Your team may already know the risk. The question is whether they feel safe saying it.
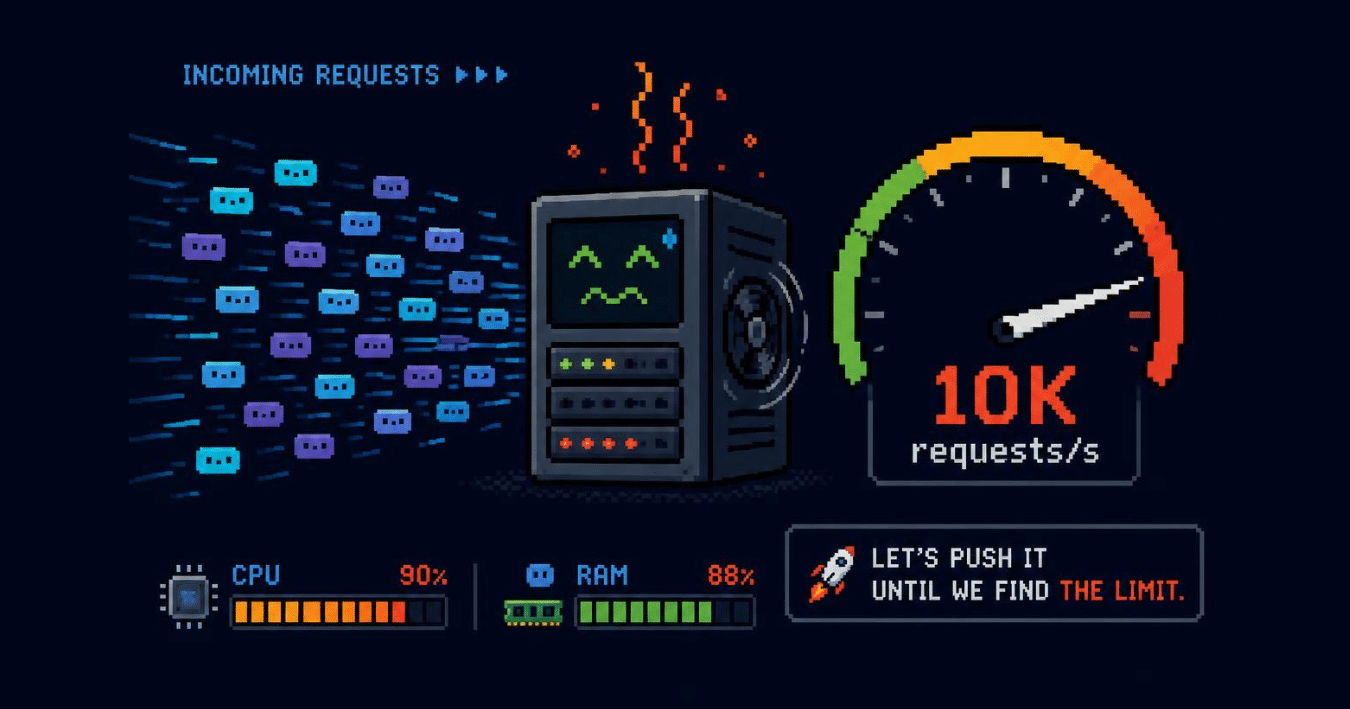
In my teamin Infobip, we handle message sending and serve as an endpoint for OTT providers such as WhatsApp, Viber, and Apple. Because of that, message sending is our core responsibility, and we need to be aware of any bottlenecks.
Initially, our service was measured at around 1,000 requests per second, but we didn’t know why.
From time to time, this raised concerns in the team: we should understand better where the bottleneck is and what causes it. Once we know that, we can make informed decisions to address client needs – for example, answering whether we can handle the traffic they expect to send. That was partly what led to this investigation.
Initially, with no experience in performance testing, I viewed the service as a set of methods – essentially a stack of calls. I assumed I could analyze it with a profiler. I also knew I shouldn’t run it on my computer, because other applications would affect the service’s performance.
That turned out to be a bad assumption. I’d suggest starting by measuring the application as a whole to get a broader view of its performance.
Since our application forwards messages further down the infrastructure and ultimately to the provider, it had to be adapted so that it would not send real traffic, while preserving as much of the original logic as possible.
Initial tests of this version showed that the service could handle a request in 0 ms, which seemed unrealistic. I realized that I needed to introduce a delay based on production, where the rounded average request processing time is around 50 ms.
Having established that the service handles one request in 50 ms, we can estimate that it can process about 20 requests per second. Since the service is Jetty-based, it has roughly 200 threads available by default, which gives a theoretical peak of around 4,000 requests per second. With that in place, the service can now be tested.
/mapi-mock/1/dummy – performs Thread.sleep(50) – so it is blocking code run on Jetty thread pool/mapi-mock/1/dummyReactor – also performs Thread.sleep(50)but publishing result on boundedElastic thread pool – it is still blocking code, but in that case one thread of reactor’s pool will be used/mapi-mock/1/messages – non-blocking code which sends request through WebClient to real service/mapi-mock/1/messagesReactor – non-blocking code which sends request through WebClient but publishing it on boundedElasticMake sure the correct memory parameter is used. In my case, HEAP_PERCENT was set to 60, meaning the JVM heap used 60% of the machine’s RAM. That allowed me to focus on machine RAM only, and the heap size would be adjusted automatically. This is not ideal, but it was good enough for our tests.
Initially, I ran the tests for 40 seconds, but I forgot that the metrics were collected every 30 seconds. That explains why I didn’t see any issues in the service metrics during the first run. When I extended the test duration to 180 seconds (a value I borrowed from similar tests) everything became visible.
You can also observe the machine directly with tools like htop or top, or any other tool that shows current CPU and memory usage. In the end, you can use whichever tool helps you complete the task.
One obvious but important rule: do not change two variables at the same time unless you know what you are doing. If you do, you won’t know which parameter had the effect. Change one thing, test it, then change the next thing, and repeat until you understand what is happening.know what is going on.
Initially, I decided to send up to 5k requests toward the service – it is below theoretical machine efficiency, but higher than what was experienced in the past. Lower CPU and RAM measurements are somewhat weird: 4 GB of RAM is not recommended as a base machine setup, because there is less than 2 GB of RAM left for the operating system, where not only our service lives, but also supporting applications. But both measurements for 2 CPU showed that it is way too low for handling any traffic efficiently and it showed quite high CPU and RAM usage, meaning that it could be improved. I finished the tests with 5k requests/s, when performance was quite near predicted performance.
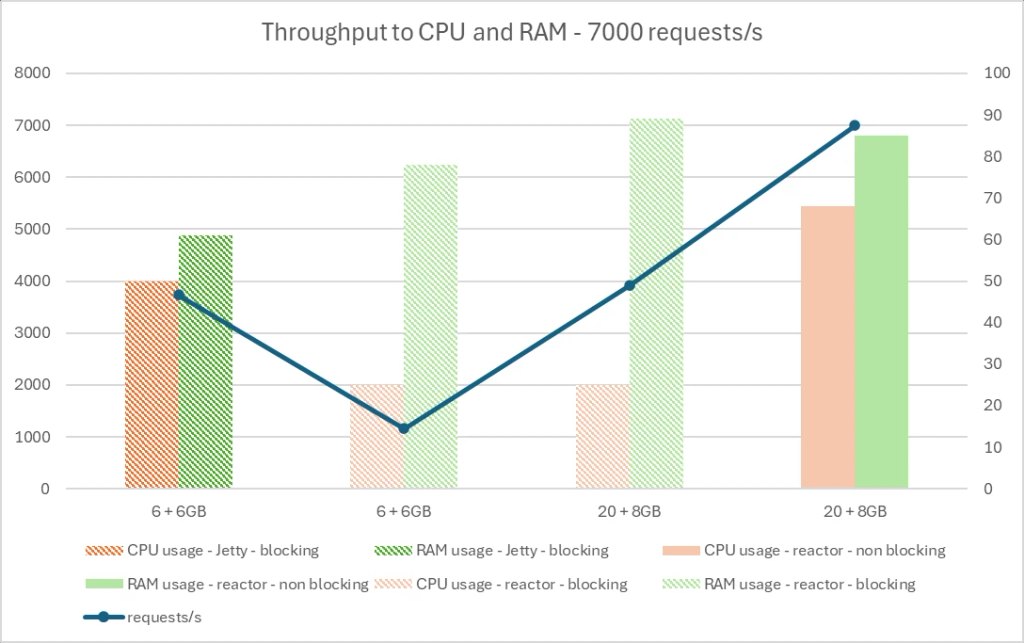
The theoretical peak was reached, so it was time to check whether it could be improved. I tried switching from Jetty pool to Reactor pool, but it turned out (my bad for not remembering Project Reactor documentation by heart) that to reach the initial performance I had to configure the machine with 20 CPU, because Reactor constructs the pool to have 10 * CPU threads. So when I matched theoretical performance again, but now with the Reactor pool, I thought about what could be done next to improve. The last thing to check was how non-blocking code would perform, so I started using the /mapi-mock/1/messages* endpoints for testing. As one would predict, it was hit. The application peaked at 7,000 requests/s, but with quite large demands for hardware. So the last thing to check was to try to find reasonable settings to have big enough performance with not much resources assigned.
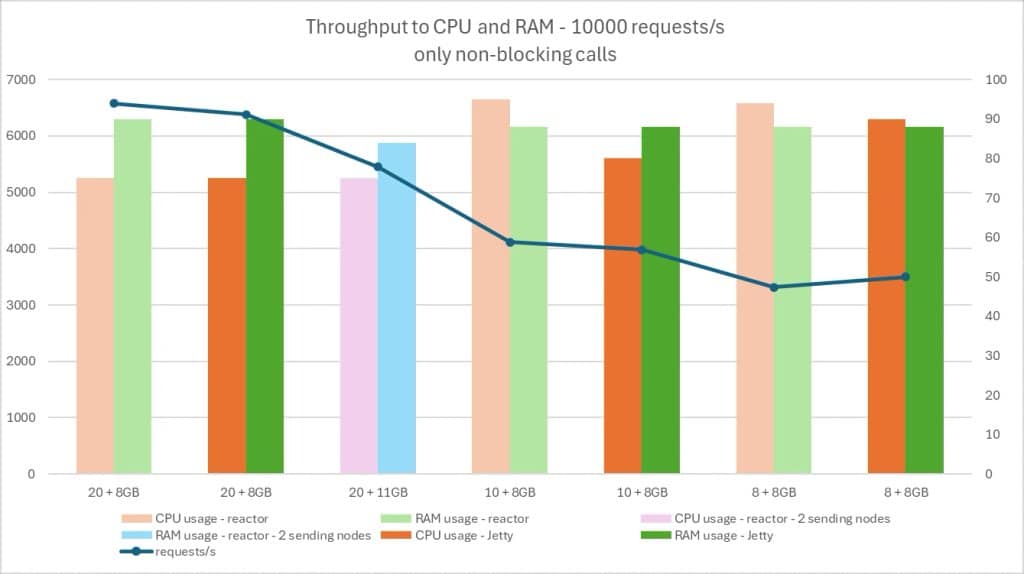
Now we are focusing on the non-blocking endpoint, so it more reflects the real-case scenario, and on limiting resources. The first thing that is apparent is that when it comes to non-blocking code, there is no difference between Jetty thread pool and boundedElastic thread pool (the latter results in some queuing because the rule of 10 * CPU threads is always true). We can see performance downgrade with CPUs removal, but not apparently linear. I had to say “stop” somewhere, and I decided to stop with 8 CPU and 8 GB of RAM, for which we received ~3.5k requests/s. Good enough with not much resources assigned. As we can scale horizontally, adding more machines will use more resources, but give more resiliency back.
As you can see, I focused on measuring reactive vs non-reactive code.
It was our go-to architecture at that time, while VT was being adopted slowly (we were afraid of thread pinning, so we waited until it was addressed in JDK 24 to start adoption). After I published it internally, I was asked specifically about VT – how the app would perform when configured to use this not-so-new-but-fixed feature.
It turned out that VT gave the app a boost. With optimal configuration (8 CPU and 8 GB of RAM) the app was able to handle 10k requests/s. Why is that? Any code, regardless of whether it is blocking or not, will be run on a virtual thread, which ideally should not block a system thread, leading to the case where system threads are used only for real logic and not for waiting. VT can improve applications where there is a lot of blocking code. In the rest of the cases, it is “just” syntactic freedom, no more looking at which operator do I need?
When I performed the tests, I observed that just switching to boundedElastic (i.e. “use Reactor and you will get higher TPS”) didn’t increase throughput – it actually reduced it. Not remembering the Project Reactor documentation by heart, I was surprised, but after some research I found that boundedElastic provides 10 * CPU threads, which gave us a total of 60 threads to service all requests previously handled by 200 Jetty threads.
When the CPU count was adjusted to match 200 Jetty threads (20 CPUs) we reached the expected throughput. But it was wasteful in terms of resources. In the Reactor world, people often say that blocking is bad, and my service was actually doing exactly that, on purpose. I thought it was time to switch to a different endpoint.
So I was able to nearly reach the estimated performance of the service, which was good. That allowed me to move on and investigate other ways of improving it, such as using non-blocking code or VT.
It is always about finding the bottleneck and finding out if we can improve it, for example by adding resources or redesigning it. If it is not to be improved, then this is the peak capacity of the service.
Sometimes questions from clients can actually help. It is just like with a new person joining the team: they will ask obvious questions about all-known solutions, but if you want to respond accurately, you have to dig deeper, and sometimes you find out that this simple question leads to an investigation and even to questioning whether it is correct at all.
Also, be aware of architecture. In that scenario, we tested a service which accepts requests, so it is one of the first applications, or APIs, which the client experiences. Being first means that there is the rest of the system, which can in turn have throttling applied. What does it mean? Even if we accept 10k requests/s, sometimes we cannot send them immediately, because an independent system cannot handle, for example, more than 2k requests/s. So we can be fast for clients, in the sense that we accept their traffic as fast as they want, but we should always remember that this is not the whole picture, and the client should be informed about it.
In my test there was no DB, just API-to-API calls. Having any limited, and even worse blocking, resource like a DB in the way of processing a request will definitely impact its performance.